


|
||

|

|
|

|
This large thematic map of Los Angeles County, titled "Family Income Los Angeles County 1960 Census," presents the median family income for each census tract, based on data from the 1960 Census. The map is color-coded using ten gradations, with light blue representing the lowest income bracket "Under $3,000" and dark orange with a black dot representing the highest bracket "$15,000 and over."
Census tracts are small geographic areas used by the Census Bureau to organize and publish results from the Census of Population and Housing, allowing for analysis on a small area basis within cities and unincorporated territory.
The map provides an at-a-glance view of the relative income levels per family in various parts of the southern portion of Los Angeles County, based on answers given during the census in April 1960 regarding income received by families in 1959.
The map presented the first official and wholly reliable income information for small areas in over 10 years, with the previous available data dating back to 1952.

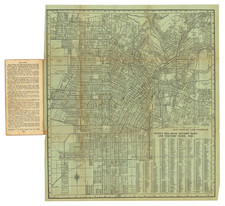

![Map of Los Angeles and Suburbs Copyrighted 1906 by A. Humitsch [Map of Los Angeles... Issued by the German-American Savings Bank]](https://storage.googleapis.com/raremaps/img/small/92785.jpg)