|
||

|

|
|

|
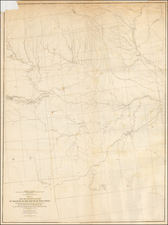
Plan For the Worst
A strategic map of Kansas City and the surrounding suburbs in both Missouri and Kansas. This chart was created by the United States Air Force in 1951 to plan for possible operations or attacks in the area. This chart is one in a series that illustrates the United States, including key population data such as the density of an area (in yellow) or the location of major hubs of activities like theatres, rail lines, and airports.
The map primarily focuses on illustrating infrastructure, like powerlines, pipelines, mines, and canals. This focus was to determine what could be strategic places for enemies to conduct an airstrike. Considering this was produced at the beginning of the Cold War, the prospect of an enemy air raid was not unheard of. Similar charts that depict other cities were also produced, implying that this series was likely made for locations deemed to have strategic value. Overall an interesting historical chart that subtly illustrates the domestic tensions of the Cold War.
This map is restricted material, intended only for internal governmental use, and an obsolete classification as of November 5, 1953. The title states this is the 2nd edition, published in July 1951.

![Mapa et tierra q[u]e yos pedro Vial taigo transitau en St. Tafee este dia 18 de Octubre de La ao 1787](https://storage.googleapis.com/raremaps/img/small/3645.jpg)