


|
||

|

|
|

|
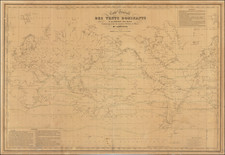
This chart, created in August 1968 for Apollo Mission 7, preserves the official mapping of the mission's trajectory and provides a comprehensive overview of the ground track from revolutions 17 through 169. Prepared by the Aeronautical Chart and Information Center of the United States Air Force for NASA, this first edition chart is a testament to the planning and coordination required for the Apollo missions.
Apollo Mission 7, a key mission in the Apollo program, was instrumental in testing the Apollo Command/Service Module, the primary spacecraft component for the lunar missions.
The chart employs the Mercator projection and is scaled at 1:40,000,000 at the Equator, presenting a global view with marked "Planned Landing Zone Symbols" in the West Atlantic, East Atlantic, West Pacific, and Mid-Pacific regions. These zones, highlighted with grey circles in the ocean, denote the areas designated for potential spacecraft recovery, emphasizing the global scope of the Apollo missions. The reverse side of the chart, detailing ground track coordinates for specific revolutions, illustrates the thoroughness of trajectory mapping.
Additional features include a legend indicating international boundaries, capital cities, other cities, airfields, tracking station categories, and symbols for tracking limits based on spacecraft altitude and antenna coverage.
![[ Scandinavian Airlines and Northwest Airlines Route Map ] make your business trip a dream trip . . .](https://storage.googleapis.com/raremaps/img/small/101758.jpg)


![Great Overland Route! Chicago Rock Island and Pacific RR for California, Oregon Australia, China and Japan. [Cover title.]](https://storage.googleapis.com/raremaps/img/small/72924.jpg)