


|
||

|

|
|

|
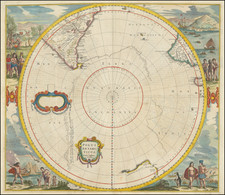
The "South Polar Chart," crafted by J.G. Bartholomew in 1886 and employing Lambert's equal-area projection, was drawn for the Scottish Geographical Society, based upon John Murray's hypothetical outlines of the continent.
The map delineates the elevations of land and the depths of the Southern Ocean encircling Antarctica, with remarkable precision for its time. The chart's detailed legend clarifies the meaning of its varied markings: soundings are indicated in fathoms, land elevations in English feet, and the extent of drift and pack ice is differentiated by distinct patterns. Points reached by explorers are marked, with Captain Cook’s 1773 voyage notably highlighted.
Furthermore, the contouring system, depicted in a separate key, employs a gradation of colors to illustrate topographic elevations and bathymetric depths, providing a clear visual reference for the relief of the land and seabed. The highest peaks, such as Mount Aconcagua and Mount Erebus, are shown alongside their altitudinal measurements, and the unexplored regions are left uncolored, revealing the limitations of contemporary geographical knowledge.
This map is of historical significance, documenting the scope of Antarctic exploration. It visualizes the cumulative geographical knowledge procured by intrepid explorers who ventured into the perilous Antarctic waters.

![Tabula Geographica Hemisphaerii Borealis ad emenatiora quae adhuc prodieruntexampla jusqu Acad. Reg. Scient. et Eleg. Litt. Boruss. descripta [with:] Tabula Geographica Hemisphaerii Australis...](https://storage.googleapis.com/raremaps/img/small/81806.jpg)
![[Parts for a Klinger globe]](https://storage.googleapis.com/raremaps/img/small/46375.jpg)