|
||

|

|
|

|
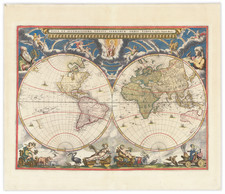
Rare large-format sea chart of the world on Edward Wright's Projection, published in 1728, after the efforts from some of Britain's leading scientific figures, including Edmund Halley, John Senex and John Harris.
This magnificent sea chart embraces the entire World between 60 degrees North and 60 degrees South. It is presented on Edward Wright's Projection, an ingenious modification of Gerhard Mercator's Projection, making the latter more applicable to the imperatives of practical navigation. While published in 1728, the chart is of a very modern empiricist style more reminiscent of the late 18th Century.
On the Geography of the Chart
The chart features a number of discoveries and curious cartographic misconceptions. Notably, it shows the outlines of the western two-thirds of Australia, based on the discoveries of explorers working for the Dutch east India Company (the VOC). These include Willem Jansz's discoveries in the Gulf of Carpentaria in 1606; the encounters of Dirk Hartog in 1616, the crew of the Leeuwin in 1622 and Pieter Nuyts in 1627, in Western Australia; Jan Cartensz and Willem van Colster discoveries in North Australia in 1623; and Abel Tasman's encounters in Tasmania and New Zealand in 1642-44. Also notable in Oceania is 'Dampeirs Strieghts' running above New Guinea, reflecting the voyages of the circumnavigating pirate-explorer William Damper in the 1690s.
Further north in Asia, the coasts of China are relatively well formed, based on Jesuit surveys. While the bottom of Korea is labeled, it is shown to be an enigma, as the groundbreaking mapping of the peninsula from the Chinese Kangxi Atlas (1718-9) was yet to reach Europe. The southern main islands of Japan are relatively well formed, however Hokkaido ('Yedso') and the Kurile Islands (Company's Land) are vaguely and only partially delineated, after the discoveries of Maarten de Vries in 1643. A related annotation on the chart questions whether 'Yedso' is an island or part of Mainland Asia, a query that would not be answered until the voyages of the Comte de la Perouse in 1787. Further to the northwest, the chart is left entirely blank.
The coasts of India, Arabia and Africa are very well formed, based on extensive navigational experience and innumerable surveys conducted by the Portuguese and the Dutch. Notably, 'I.[le] St. Mary' on Madagascar was then the pirate capital of the World and a place to be avoided by most 'legitimate' mariners. The Caspian Sea still maintains the archaic egg-like shape it had on maps until Carl van Velden's 1719-21 surveys first appeared on printed map in the early 1730s.
Turning to North America, the East Coast is quite well conveyed, save that Newfoundland is too narrow, owing to confused longitudinal readings on the part of many mapmakers. Hudson's Bay reflects the recent charts drafted for the Hudson's Bay Company. To the west, California is portrayed as a massive island, in the manner of Abraham Goos's famous 1666 chart, but to the north, the map is silent.
On the Style of the Chart
One of the most distinctive and important aspects of the map is its arresting, clean and clear style. Upon first glance (before analyzing the geography), one could be forgiven for mistaking the map as dating from the late 18th Century and not 1728. The overall picture is one of restrained elegance, free from any superfluous adornment yet with high quality engraving, attractively rendered. The emphasis is on visual clarity and scientific accuracy, unencumbered by distractions.
Far from being a mere artistic conceit, this emerging style had strong philosophical and cultural motivations. First, many 17th Century sea charts were heavy on artistic embellishments and were often lavishly colored. While some aimed to be accurate practical guides for mariners, this was often not the case, as chartmakers vied to make their charts as visually enticing as possible in order to appeal to clients, sometimes at the expense of utilitarian concerns. Charts would often show conjectural shorelines or features in an effort to fill negative space and to make the composition look complete and authoritative. They also included embellishments, such as sea monsters and outsized ships that, while pretty, were useless to mariners.
The ethic of the European Enlightenment, which commenced in the late 17th Century and gradually gathered currency throughout the 18th Century, valued judgments based on scientific observations and measurement, and rejected constructs based on traditional superstition and rumor. This 'empiricist' philosophy progressively came to dominate cartography during this period.
Specifically, with respect to Great Britain, a catastrophic event caused that nation's intelligentsia to reevaluate their attitude towards navigation and sea charts. In 1707, the entire Royal Navy fleet of Sir Cloudesley Shovell was lost upon running aground on the Isles of Scilly, Cornwall. It was soon determined that the tragedy was due to the fleet's inability to correctly discern longitude at sea and the desultory quality of sea charts. In 1714, Parliament charted the Board of Longitude to award prize money to those that could help solve the challenge of correctly finding true meridians at sea. Moreover, sea charts, based on conjecture and with visually distracting ornamentation precipitously fell out of fashion. In this respect, while the present chart includes some cartographic misconceptions (like 'California as an Island'), it generally exercises a high degree of caution and leaves areas that are unexplored blank.
Moreover, these elements dovetailed nicely with the new trends of architecture and art in in Britain. Since the ascension of the House of Hanover the British throne in 1714, the Georgian style emerged which placed emphasis on fine craftsmanship but with clean lines and restrained ornamentation.
While other maps following the 'empiricist' model were produced during the same time, the present chart takes on an exceptionally progressive form, being of a style some decades ahead of its time.
On the Projection of the Chart
The present chart was made on Edward's Wright's Projection, which became highly popular throughout the 17th and 18th Centuries. In 1569, Gerhard Mercator produced a wall map of the World that featured a groundbreaking innovation, in that the graticules of latitude and longitude were evened out to project the globe on a flat surface. This was important, as up to that time mapmakers had experimented with a variety of projections, all of which severely distorted the globe. That being said, Mercator's Projection had a downside, in that it showed the distance between meridians of longitude as being equal everywhere, regardless of the relative degree of latitude. In reality, the distance between the meridians of longitude progressively narrowed as one headed farther from the Equator until they merged at the Poles. Mercator's Projection thus grossly exaggerated distances in high-latitude regions such as Europe.
Edward Wright (1561-1614) was one of the leading scientific minds of Elizabethan and Jacobean England. In 1589, he was a mathematics fellow as Cambridge University in 1589, when Queen Elizabeth plucked him out of obscurity to become the navigator for the Duke of Cumberland's piratical expedition to the Azores. Over the next few years he refined his practical navigational skills as a mariners and came into contact with some of the leading figures of the day, including Sir Francis Drake. He was quickly confronted with the limitations of Mercator's Projection and upon his return to England, he experimented with some of his theories while working with England's first globemaker, Emery Molyneaux.
Wright soon developed a series of mathematical equations, by which mariners could compensate for the narrowing of the distance between the meridians, and found that by placing rhumb lines strategically on a chart based Mercator's Projection that could allow a mariner to apply these calculations to the chart. Wright's ideas circulated informally in London, and were 'pirated' by Jodocus Hondius, and first used Wright's Projection on his "Christian Knight Map" (Amsterdam, of 1597)
Wright first published his ideas on reforming projection in his book Certaine Errors in Navigation (London, 1599), which was accompanied by a magnificent world chart, Wright's Chart of the World on Mercator's Projection (1599), the first large-format World map printed in Britain.
About a century later, Edmund Halley (1656-1742) who was described as "the first versatile thematic cartographer", as well as being brilliant astronomer and practical scientist, employed Wright's Projection on a number of his own charts, including A New and Correct Chart shewing the Variations of the Compass… (1701), the first printed map to employ isogonals (or isolines), depicting the declinations of the compass. Halley suggested some amendments to Wright's Projection, to accord to his experiments with magnetic declination.
On the Publication of the Chart
Halley's ideas were then taken up by John Senex (1678-1740), the Royal Geographer to the King, and John Harris, probably the finest mathematical instrument maker in England during the 1720s. They derived the present chart, complete with the best available geography to demonstrate Wright's Projection as amended by Halley.
The chart became the grandest element of a sea atlas developed by Senex and Harris to compete with Mount & Page's wildly popular English Pilot sea series. It was published the Atlas Maritimus et commercialis, or A general view of the world... (London: James and John Knapton et al., 1728), and the present chart appeared as plates 1 and 2 (together forming a single chart).
The present chart is an exceptionally fine and important early example of Enlightenment 'empiricist' cartography at its best. The map is also rare and seldom appears on the market, especially with both halves of the chart present.
John Senex (1678-1740) was one of the foremost mapmakers in England in the early eighteenth century. He was also a surveyor, globemaker, and geographer. As a young man, he was apprenticed to Robert Clavell, a bookseller. He worked with several mapmakers over the course of his career, including Jeremiah Seller and Charles Price. In 1728, Senex was elected as a Fellow of the Royal Society, a rarity for mapmakers. The Fellowship reflects his career-long association as engraver to the Society and publisher of maps by Edmund Halley, among other luminaries. He is best known for his English Atlas (1714), which remained in print until the 1760s. After his death in 1740 his widow, Mary, carried on the business until 1755. Thereafter, his stock was acquired by William Herbert and Robert Sayer (maps) and James Ferguson (globes).
Edmund Halley (ca. 1656-1742) was one of Britain’s foremost astronomers and natural philosophers. He was also an explorer and mapmaker famous for his voyages to study magnetic variation. Edmund was born in Shoreditch, London. After the Great Fire of 1666, his family moved to Winchester Street, near where the Royal Society, one of the world’s first scientific societies, then had its rooms.
Halley began his astronomical observations as a schoolboy at St. Paul’s School and later at Queen’s College, Oxford. By the time he left Oxford, he had already written three scientific papers and was in touch with the foremost minds in Europe, including the architect Christopher Wren, the natural philosopher Robert Hooke, and fellow astronomers, John Flamsteed, Jean Dominique Cassini, and Johann Hevelius.
Halley left Oxford without a degree because he wanted to travel to St. Helena to determine the positions of the southern stars and to observe the Transit of Mercury, a project he embarked on with the support of Charles II and the East India Company. Although not entirely successful, the star chart he published as a result earned him Fellowship in the Royal Society. In 1680, Halley and a school friend embarked on a scientific Grand Tour of Europe, observing, en route, the first appearance of a bright comet.
He discussed this comet with Isaac Newton upon his return. Halley struck up a great friendship with Newton and oversaw the publication of Newton’s masterpiece, Philosphiae naturalis principia mathematica (1687). Halley wrote the Latin preface to the work, the most important in the field of physics ever published.
In the 1680s, Halley became interested in magnetic variation. As part of these studies, he produced one of his first known maps, a chart of the trade winds, the first such meteorological chart of its kind. To gather more data on the worldwide phenomena, Halley gathered information about winds and magnetic variation from a global network and took to the sea himself to make surveys and observations. In 1689 he presented a chart of the Thames approaches to the Royal Society. In 1691, he improved the design of a diving bell to help with the salvage of a cargo of gold and ivory.
Halley’s interest in sailing and charting continued in the 1690s, even as he worked as warden to the country mint at Chester. He published a flurry of scientific papers in this decade on topics including life expectancy, optics, rainbows, thermometers, and barometers. Most influential of his work for this time, he calculated the orbit of 24 comets and concluded that comets like the one he saw while on the Grand Tour have elliptical orbits. He also explained that the comet of 1682 had a return period of roughly 75 years; this comet was later named for Halley.
In 1698, Halley was given command of the purpose-built Royal Naval ship the Paramore. He set sail for the South Atlantic to make observations of magnetic variation. He embarked on a second cruise in 1699, also to the South Atlantic. These two voyages served as the basis for a chart of magnetic variation that covered the entire Atlantic, the first surviving chart to use isogonic lines and one of the first thematic charts ever produced. In 1701, Halley took the Paramore on a final cruise in the English Channel, which resulted in another chart that was a vast improvement on previous Channel charts.
Upon outbreak of the War of Spanish Succession, Halley was charged with surveying on behalf of England, a role which took him to the Adriatic. After completing his work there, he returned to an appointment as Savilian Professor of Geometry at Oxford. One of his major projects while there was to publish Flamsteed’s star charts, a project which contributed to the already stormy relationship between the men. In 1715, Halley drew a map of totality for a rare solar eclipse that would pass through London; his observations were still being used by astronomers in the twentieth century. In 1721, he succeeded Flamsteed as the second Astronomer Royal and moved to Greenwich, where he was concerned with the saronic cycle of the moon and, as ever, comets. He died there in 1742.
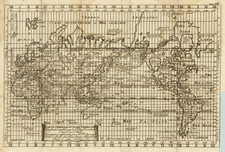
![Western Hemisphere [and] Eastern Hemisphere](https://storage.googleapis.com/raremaps/img/small/77454.jpg)