|
||

|

|
|

|
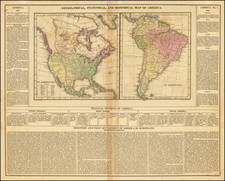
Intersting "Economic Map of North America," focusing on the industrial, agricultural, and resource distribution across the continent. Th
The first inset, a part of the map's legend, differentiates areas by their economic productivity: "Industrial Districts" are marked in orange, "Productive Regions" in green, and "Non-Productive" areas in gray. The symbols represent primary resources or industries, including Coal (⚫), Iron (⚪), Silver (⚬), Copper (⊕), Gold (+), and Petroleum (⊡).
The second inset focuses on agricultural products, denoted by initials for easier identification on the map: Barley (B), Cacao (Ca), Coffee (Cf), Cotton (Ct), Fruit (Fr), Maize (M), Oats (O), Rice (Ri), Sugar (Su), Tobacco (T), Vine (V), and Wheat (W). These symbols help identify the primary agricultural outputs of various regions.
The third image zooms in on a specific area, likely the northeastern United States and southeastern Canada, indicating the distribution of key resources and manufacturing sectors. Symbols on this section denote specific industries such as Apparel (A), Cotton (C), Iron & Steel (represented by a gear symbol), Jewelry (J), Leather (L), Milling (M), Pottery (P), Silk (S), Tobacco (T), Woollens (W), and Shipbuilding (represented by an anchor symbol). Additionally, monetary symbols ($) mark industrial or economic centers.
![[Educational Map] North America](https://storage.googleapis.com/raremaps/img/small/68773.jpg)