|
||

|

|
|

|
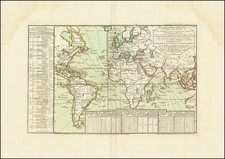
The presented map, Meteorological Map of the World Showing the Distribution of the Temperature of the Air, offers a global view of climate patterns by charting the distribution of air temperature. The map's color gradients succinctly communicate varying climatic zones, providing a visualization of the Earth's diverse thermal landscape.
This meteorological document elucidates the temperature differences from the equatorial regions to the poles, with distinct color coding representing varying temperature bands. Such visual demarcation allows for immediate recognition of the temperate, tropical, and polar climates, as well as the subtle variations within these broad categories. The map encompasses the entirety of the globe, with meridians and parallels marked to facilitate precise geographic orientation.
The map includes annotations that elucidate specific phenomena, such as the currents of warm and cold air, with arrows indicating the Gulf Stream and the currents derived from the Arctic. The isothermal lines that arch across the continents and oceans illustrate the imaginary lines connecting points of equal temperature, thereby providing an overview of the global heat balance.
Dated from a period when meteorology was becoming increasingly empirical and analytical, this map serves as a testament to the scientific endeavors of the time to understand the complexities of Earth’s atmospheric conditions. It provides a foundation for understanding historical perspectives on climate, presaging modern concerns about climate change and variability.
Not only does the map function as a pedagogic tool for climatological studies, but it also stands as a historical artifact reflecting the state of meteorological knowledge and cartographic skills of its era. It invites contemplation on the advancements in meteorological science and the enduring importance of such comprehensive climatic assessments.
![[Olivier van Noort Portrait / World Map]](https://storage.googleapis.com/raremaps/img/small/79567.jpg)