|
||

|

|
|

|
Geological Assessment, Field Notes and Analysis from the West Newport Oil Field
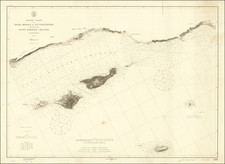
Detailed cadastral contour map of a portion of Huntington Beach, California, prepared in connection with oil exploration and drilling in the region.
The map covers the are between Beach Blvd and Brookhurst, from the Pacific Coast Highway to Yorktown Avenue. The primary focal point of the map is an are shaded in yellow apparently owned by Standard Oil Company and an area in shaded in green and a contour epicenter to the north in the poeprty of D.D. & Dorothy Dunlop. Over a dozen other oil companies and individual land owners are noted.
Contour lines note details such as "Probable Production Limit", with annotations in blue showing the Inglewood Fault Line and subsequent lines at 3000 and 5000 feet from the fault line. A second set of similar lines, which are unnamed, radiate out in red to the east, from the area shaded in Greenm with notes that may reflect lease costs, and the locations of wells and abandoned wells in pencil, as well a other notes like "Blew out 10MM".
The map is covered with pencil and pen notes which are apparently being used in calculating price and production information which correlates to the fault lines and contours on the map.
The map would seem to be an amalgam of field notes, details and visual representations of one the area.
West Newport Oil Field
The history of the West Newport Oil Field is a tale of discovery and development that has spanned over half a century. The field's story began with the first attempts to harness its natural resources following the observation of oil seepages in the Newport-Costa Mesa area, which motivated the initial drilling of wells as far back as the year 1904.
The field's potential began to be realized when D. W. Elliot drilled a well in April 1943. This well, which would later come under the operation of G. E. Kadane and Sons as Banning No. 1, was the first to achieve commercial production. Completed in the "C" sand, the well initially produced 40 barrels of oil per day with an oil gravity of 14.5° API. The discovery of oil production in the "A" and "B" zones to the north and east of Elliot's well gave rise to what is identified as the Main area of the West Newport Oil Field, setting a precedent for the region's oil extraction activities.
In the following years, further explorations and developments were carried out. In April 1945, the Atha Exploration Company completed the Newland No. 12-3 well as a gas well, later to be known as the Red Star Oil Company well Newland No. 4A. With an estimated initial production of 7,000 thousand cubic feet per day from a zone above division A, it marked the expansion of the field's capabilities. However, it was the "A" and "B" zone oil productions that eventually took precedence, with the gas sand playing a lesser role in what became known as the Aldrich area.
A significant discovery was made in July 1946 when L. W. Lyddon drilled well Anaheim Sugar No. 7-1, which would later be operated by Morton and Sons. This well tapped into the Lyddon zone and began producing 1,000 barrels of oil per day at 17.5° API gravity, becoming a part of the Anaheim Sugar area.
The field continued to grow, and in January 1952, the Surf area was delineated with the completion of Pacific Supply Cooperative's well Surf No. 1. This well, which was completed in the "A" zone, produced 130 barrels of oil per day with an oil gravity of 22° API, extending the productive reach of the field eastward from Huntington Beach.
In a notable advancement, October 1947 saw the first extraction of Repetto (lower Pliocene) oil by Republic Operators' well Newland No. 3, later operated by Surfland Oil Company. The well produced 150 barrels of oil per day from the lower Bolsa sand at 18° API gravity.
Further discovery in the "D2" and "D4" sands occurred in March 1948, when D. D. Dunlap and Dorothy Dunlap drilled well Aldrich Land Company No. 10. This well added to the field's profile with an initial production of 258 barrels of oil per day at 18.6° API gravity from the "D4" sand, marking another expansion within the Anaheim Sugar area.
The geologic foundation contributing to the field's oil production is the Inglewood fault system, a part of the broader Inglewood-Newport uplift. This system is characterized by two primary faults that diverge southeastward from the field's northwestern limits. These normal faults have steep dips to the southwest, with vertical displacements of up to 2,000 feet. The Inglewood fault system is further complicated by numerous tear faults caused by horizontal movement. These secondary faults intersect the main system at approximately 30° angles, creating barriers to fluid migration, though they exhibit only minor vertical displacements.
Regionally, beyond the Inglewood fault system, the geological beds take a northeastern tilt from the San Joaquin Hills, contributing to the complex subsurface structure that has challenged and yet facilitated the oil field's development.
The above chronology draws upon the detailed accounts and geological assessments provided by D. R. Allen and J. E. Joujon-Roche, as well as the foundational report by A. L. Hunter (maker of this map) and D. R. Allen from 1956.
![[Corona Del Mar]](https://storage.googleapis.com/raremaps/img/small/66927.jpg)
![[Imperial & Coachella Valley Advertising Map -- Valerie Jean Date Shop]](https://storage.googleapis.com/raremaps/img/small/69651.jpg)