|
||

|

|
|

|
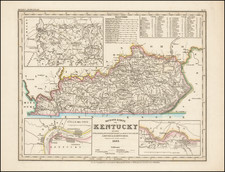
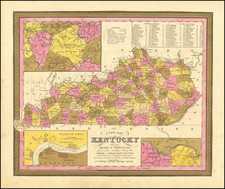
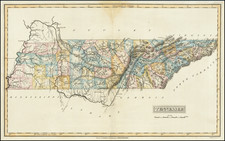
O.W. Gray's map of Kentucky and Tennessee, published in Philadelphia, stands as a clear representation of the two southern states in the last quarter of the 19th Century. Its large format ensures a clear view of the intricate details provided, which are of particular interest to those seeking a comprehensive understanding of the area.
One notable feature is its color-coding by counties. This demarcation offers a straightforward way to differentiate and understand the administrative boundaries and sizes of each county.
Further adding to the map's utility are several inset maps and tables:
-
System of Railroads in KY and TN: This inset displays the transportation networks within the states. Given the importance of railroads in this era for trade and connectivity, this feature offers vital insight into the economic and infrastructural layout.
-
Hypsometric Sketch: Hypsometry deals with the measurement of elevation. Gray's hypsometric sketch presents the elevations of Kentucky and Tennessee, offering an understanding of the region's topography. This detail is especially useful for grasping the landscape, be it valleys, plateaus, or highlands.
-
Table of Comparative Increases in Populations: A simple comparative table shows the population growth of both states over a certain period, providing an indication of demographic trends.
-
Population Density Map: Using distinct color codings, this map highlights areas based on their population concentration, making it easier to identify urban and rural regions.
In summary, O.W. Gray's map of Kentucky and Tennessee offers a multifaceted view of the states, capturing not just geographical boundaries but also socio-economic and topographical details. Its precision and inclusion of insets make it a valuable tool for a range of users, from historians to geographers.