|
||

|

|
|

|
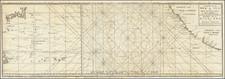
The Great Flood of 1938
A scientific chart illustrating the massive rainfall that impacted Southern California during 1938. From February 27 to March 4, 1938, two major rainstorms swept through Southern California, bringing anywhere from ten to thirty inches of rain in some areas. Such a torrential downpour caused flash floods which decimated Los Angeles, Orange, and Riverside Counties. This map was produced to better understand the atmospheric conditions that led to the flood and how susceptible the region's infrastructure may be towards future storm events.
This chart illustrates how many inches of rain certain areas got and to what extent the flood waters impacted the region. Utilizing a 1901 geological survey of the region, the map shows Los Angeles, Riverside, and San Bernadino Counties overlaid with blue lines. These lines represent flood discharge and the amount of rain certain areas received during the storms. This data was key for officials who wanted to prevent such a tragedy from occurring again by improving drainage and flood infrastructure.
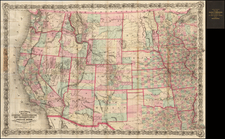
![[ Imperial County / Annotated by County Surveyor ] Denny's Pocket Map of Imperial County](https://storage.googleapis.com/raremaps/img/small/87140.jpg)