|
||

|

|
|

|
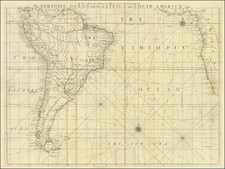
Rare separately issued chart of the South Atlantic, focusing on the prevailing currents and winds (including scientific data relating the the Gulf Stream), as observed and compiled by Matthew Fontaine Maury, then serving as Lieutenant in the U.S. Navy.
Maury's seminal work on the Oceans currents and related atmospheric phenomena commenced in 1847, with the publication of his map of the currents of the North Atlantic (Schwartz & Ehrenberg 278) and culminated with T he Physical Geography of the Sea, published in 1855. While preparing the charts Maury sought the cooperation of mariners from many nations, getting them to report to him their regular observations of winds and currents, which he either added or corrected on his own charts. This was the Age of the great Clipper Ships, and their masters prized Maury's charts as by following their wind and current directions, they were able to cut many days off their voyages from North American ports to the Far East, as also the Clippers racing to and from New York and San Francisco.
In all Maury issued six types of chart of the Atlantic, Pacific, and Indian Oceans, each presenting a different data set: Series A, track charts (of which this is an example); Series B, trade wind charts; Series C, pilot charts; Series D, thermal charts; Series E, storm and rain Charts; and Series F, whale charts.
Maury was the chief Naval Officer in charge of charts from 1843 to 1861. His work describing seasonal winds and currents was conceived largely outside conventional academic circles. Maury was made an honorary member of the Boston Marine Society, where his portrait was hung, and later turned upside down when he later elected to join the Confederacy during the American Civil War.
![[ South America ] Tierra Nova](https://storage.googleapis.com/raremaps/img/small/94058.jpg)