Search
Portolan charts are some of the most revered of cartographic objects, valued for their aesthetic, iconographic, and technical qualities. They are also historically significant, one of the first types of maritime charts and one of the earliest genres of regional mapping. Portolans developed in the medieval Mediterranean, but they combine elite and craft knowledge from Arab, Byzantine, Western Asian, as well as European navigational and mapping traditions. As Sonja Brentjes explains, “medieval adorned portolan charts are highly complex, polyglot cultural products that bespeak the creativity of their makers and the curiosity of their users, as well as the complexities of cultural interaction in the Mediterranean.”
The modern charts in use today find their lineage in Mediterranean portolan charts. However, earlier charts are known in Chinese and Arab contexts. Additionally, the development of the chart was not a foregone conclusion. Charts are first recorded at the conjunction of several world historical trends, including the expansion of trade over wider maritime networks, and at the conjunction of several navigational technologies, including the written sailing direction, or rutter, and the use of the magnetic compass, originally invented in China. The earliest known list of ports and coastal features, a periplus, was used by the Greeks, with an example surviving from the fourth century CE. These textual sailing directions are known to have existed alongside visual aids in the Mediterranean from at least the thirteenth century CE.
The word portolan developed from the Italian word for sailing directions, portolano or portulano, again underlining the close connection between different types of navigational tools. The first surviving portolan chart dates to ca. 1290. The Carte Pisane, probably made in Genoa and held at the Bibliotheque Nationale in Paris, depicts the Mediterranean Sea, as do many portolan charts. While the earliest example of a navigational chart to survive, it is certainly not the first of its type, as its striking accuracy and defined features attest. The development of the portolan chart before the Carte Pisane, that is, before we have reliable sources, is still a hotly contested academic debate.
Portolan charts typically consist of ink on vellum, made of calfskin, or parchment, usually goatskin. Vellum and calfskin are durable, an important attribute for objects that were to be used in the trying conditions of a ship at sea. Additionally, vellum and parchment can be corrected by scraping off a layer of ink and replacing it with new words or images, which was useful for correcting changeable navigational information. While many portolans were made to be used at sea, those that survive are usually those that were intended for an easier life on land, as luxurious presentation items, decorations, or instructional aids. Those that saw service at sea seldom survived the ordeal to enter the historical record, but other sources mention their use aboard ships.
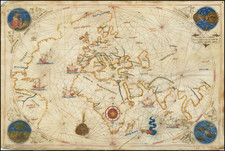
Portolan charts share a set of conventions that would become standard for later nautical charts. They usually include a scale bar, although the unit of measure differed depending on its place of production. Important port names were written in red, while others were listed in black. These were written at right angles to the shore, and were written inland, so as not to obscure the coastline. Black dots or a cross were used to indicate rocks, while red dots indicated sandy shallows or a sandbar. Inland areas were usually devoid of geographic content, but could be filled with decoration and imagery indicating the ruler and religion prevalent in each place, not to mention local animals, plants, and other details.
Another defining feature of portolan charts are the rhumb lines, or loxodromes, that crisscross their surfaces. Rhumb lines are lines of consistent bearing. Originally, they were based on wind roses of 16 or 32 directions. The main winds would be indicated in black (or sometimes red), half winds in green, and quarter winds in red. Scholars have shown that this matrix of lines was laid down first, followed by the coasts and names, indicating that these charts were intended as instruments to find direction and bearing, not just as representations of space. Later portolan charts have the rhumb lines join at compass roses, which use cardinal and ordinal directions.
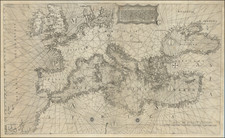
Many surviving portolans show the Mediterranean coastline, but others also depict the Black Sea, the Atlantic Coast of Europe and West Africa, the Indian Ocean, and other maritime spaces. While primarily meant to communicate nautical details, they also integrate larger geographic ideas such as the re-popularization of Ptolemy in the Renaissance. Their zenith was in the fourteenth and fifteenth centuries, but they continued to be made up to roughly 1700. The main early centers of production were Genoa, Venice, and, later, Catalonia, with important hubs in Mallorca and Sicily.
Archived