|
||

|

|
|

|
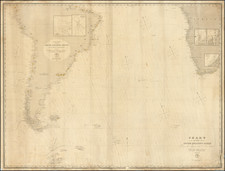
Interesting thematic chart of the currents off the Cape of Good Hope, made to accompany Captain Toynbee's paper on the specific gravity, temperature, and currents of the sea, presenting the findings from five consecutive yearly voyages from England to India between 1860 and 1864.
This informative map, created by S. Com. C. George, Map Curator of the Royal Geographical Society, and made by Edward Weller, is based on the logbooks of Captain Toynbee's voyages. It features colored lines representing Toynbee's outward tracks for each year, with red for 1860, blue for 1861, green for 1862, yellow for 1863, and dashed lines for 1864. The chart offers a valuable perspective on the oceanic currents and temperatures during the mid-19th century, particularly in the region of the Cape of Good Hope.
The map includes a note explaining the use of blue contour lines to represent the limits of the cold, ice-bearing current with temperatures between 40° and 50°, and red contour lines indicating the warm current with temperatures of 60° and above. The chart also denotes surface temperatures with precise figures and displays the direction of currents with arrows indicating velocity. Each date on the map is underlined with the same color as the track it corresponds to.
This detailed chart captures the oceanic conditions during August and September at a parallel of around 40°, as well as near and around the Cape of Good Hope during February. The map serves as a valuable historical artifact for those interested in the study of oceanography, navigation, and the history of maritime exploration during the 19th century.

![[Southern Africa] Tabula nova partis Africae](https://storage.googleapis.com/raremaps/img/small/103295.jpg)