


|
||

|

|
|

|
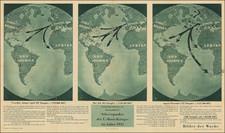
A scarce chart from the foundational climatic mapping series of the 19th century, the U.S. Navy's Pilot Chart series.
The map shows prevailing ocean currents and navigational hazards during May 1891. The chart packs an enormous amount of information into the sheet, with extensive reports on issues such as the use of oil to reduce vessel instability in heavy seas, waterspouts, etc. At the top of the map is a graph of barometric readings for every day of the month. The chart also includes a notice on the publication, cancelation, and correction of U.S. Hydrographic Office charts in May of '91.
The Origin of the Pilot Chart Series
The U.S. Navy began its involvement in continuous meteorological observation in 1838 when the Secretary of the Navy directed the Depot of Charts and Instruments to begin continuous three-hourly meteorological observations, day and night. The funding for this project continued yearly as late as 1859.
In his history of the U.S. Navy's marine meteorology projects, Charles C. Bates writes:
The catalyst for advancing the meteorological program, however, was Lieutenant Matthew Fontaine Maury, U.S.N., who was appointed Depot Superintendent on July 11, 1842. One of the intellectual giants of his time, Maury brought a farseeing mind, a flair for writing, and unflagging energy to his new assignment, a post more frequently referred to as the "Hydrographical Office" accompanied by some version of "National or Naval Observatory" than as a "Depot." Maury immediately organized an extensive system for collection of environmental data from logs of warships and domestic and foreign merchant vessels such as wind, air pressure and temperature, set and speed of ocean currents, and water temperature. His ambitious program began to pay dividends in a chart series issued between 1844 and 1861 without charge to the mariner in return for complete and accurate observations. Comprising this "Wind and Current Chart" series were Track Charts, Trade-Wind Charts, Pilot Charts, Whale Charts, Thermal Charts, and Storm and Rain Charts. . .
A report made in 1886 by a United States Senate Commission summarizes his contributions as follows:
"The wise and patient labors of Lieutenant Matthew F. Maury in meteorological research, led to the connection of the Government of the United States with the direct effort to utilize that science for the benefit of navigators, and for the extension of its advantages to the people at large.
"The eminent success of Lieutenant Maury in his studies of the physical geography of the sea and its meteorology has strengthened the belief that the collection and comparison of the facts through years of continuous and accurate observations made on land, at proper localities, will result in the discovery of the laws that govern atmospheric, electric and magnetic movements and conditions, so as to reduce them to a practical science.
"In 1853, the United States sent Lieutenant Maury to a general maritime conference, held at Brussels, at which a recommendation was made that a log-book should be kept on board vessels of war and merchant vessels, in which the observations relating to the weather should be carefully recorded. These were brought together, studied and compared by him, and the introduction was thus made of the science of meteorology as a means, to be provided by law, for the benefit of all who were concerned in navigation."
The Civil War caused a massive interruption to this project, as it saw Maury leave to become a Commodore in the Confederate Navy. Furthermore, the collection of data from merchant vessels ceased in 1861. Data collection began again more than 10 years, later, in 1873, and some meteorological charts were issued from 1876. Finally, in December of 1883, the first continuous monthly charts began publication in the form of the Pilot Chart of the North Atlantic Ocean series. The Annual Report of the Hydrographer for 1884 summarized the purpose and nature of the charts:
These charts present the principal meteorological phenomena of the ocean in a graphic form for each month of the year. The method is so comprehensible that a mere inspection shows what meteorological conditions the mariner may expect in each five degree square of the ocean surface. The data for these charts have been deduced from over two million hours of observations, extending over a period of forty years.
The collection of data for the study of the meteorology of the ocean has been facilitated in a remarkable degree. . . . The number of vessels boarded by the officers attached to the branch offices during the year is 4,256; barometers corrected or compared 2,062; abstracts of logs made, 873; ice reported by 242 vessels. . . .
The series was extended to the North Pacific first and then to other sections of the globe. In 1915, with the issuance of the Pilot Chart, Central American Waters, the coverage of the whole world was complete. When airplanes began making the Transatlantic journey, the Hydrographic Office responded in 1927 by issue the first of a series of monthly Upper Air Pilot Charts, North Atlantic Ocean, portraying prevailing winds at the surface, 2,500, 5,000 and 10,000-foot levels.
P.L. Richardson notes that the tracking of derelict floating wrecks and bottles by the Pilot Charts represents "the first large-scale and long-term measurement of ocean trajectories."
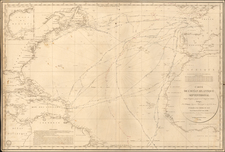
![[Untitled Map of The Atlantic Ocean, Europe, Africa, the Middle East, and Eastern Canada]](https://storage.googleapis.com/raremaps/img/small/89582.jpg)
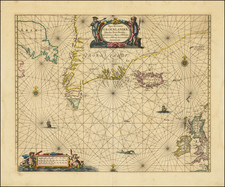
![[Terceira Island] Tercera](https://storage.googleapis.com/raremaps/img/small/76123.jpg)
![[ Letter of Marque ] Articles of Agreement and Engagement of the Privateer or Letter of Marque the Alarm belonging unto the Island of Guernsey . . . 1798](https://storage.googleapis.com/raremaps/img/small/100233.jpg)