|
||

|

|
|

|
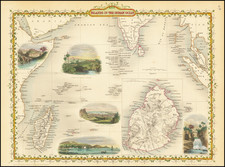
Indispensable for any 19th-Century Indian-Ocean-Faring Sea Captain
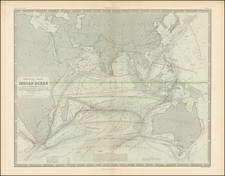
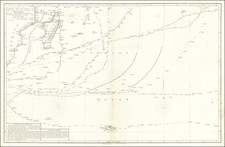
Two important maps and a chart on one large sheet produced for navigational purposes by Matthew Fontaine Maury, the leading US hydrographer at the time. The maps show the Indian Ocean during the summer and winter months, plotting monsoonal variations for the trade winds. This chart allowed ship captains to plot the best routes through the Indian Ocean at any point of the year, and Maury's charts were credited as substantially reducing the transit times of ships during the mid-19th century.
The lithograph is divided into three sections. In the lower-left is a map of the Indian Ocean showing the dominant winds in February, when the northeast monsoon is dominant, while the lower-right map shows the same area in August when the southeast monsoon is dominant. At the top is a plot of longitude vs latitude, showing changing latitude of the doldrums, trade winds, and monsoons as a function of the month. This complicated chart, based on tens of thousands of measurements, would have been used by ship captains as the foremost authority on sailing. A detailed explanation of how to use the chart appears in the upper right.
Maury produced six types of charts, as documented by the University of Wisconsin Milwaukee: Series A were track charts; Series B were trade wind charts; Series C were pilot charts; Series D were thermal charts; Series E were storm and rain charts; and Series F were the elusive whale charts. The Annotated History of the Gulf Stream Currents says of Maury that "Captains who were once reluctant to take part in Maury's study began to take notice when crossing times began to be dramatically reduced. One captain cut 35 days off a 110-day journey to Rio de Janeiro. Maury offered the charts for free to anyone who would send in data. Time was money for the sea captains."
Lieutenant Maury's Work on Hydrography
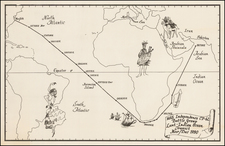
Maury's seminal work on the Oceans currents and related atmospheric phenomena was commenced in 1847, with the publication of his map of the currents of the North Atlantic (Schwartz & Ehrenberg 278) and culminated with The Physical Geography of the Sea, published in 1855. While preparing the charts Maury sought the cooperation of mariners from many nations, getting them to report to him their regular observations of winds and currents, which he either added or corrected on his own charts.
This was the Age of the great clipper ships, and their masters prized Maury's charts. By following their wind and current directions, they were able to cut many days off their voyages from North American ports to Europe and Asia, as well as from New York to San Francisco.
Maury was the chief Naval Officer in charge of charts from 1843 to 1861. His work describing seasonal winds and currents was conceived largely outside conventional academic circles. Maury was made an honorary member of the Boston Marine Society, where his portrait was hung, and later turned upside down when he later elected to join the Confederacy during the American Civil War.
Rarity
OCLC locates separate examples only at Stanford, Yale, Brown, Library of Congress, BSB, and British Library. Rare Book Hub lists no examples of this Series B chart.